It’s a multibillion dollar question: What will happen to water as temperatures continue to rise? There will be winners and losers with any change that redistributes where, when and how much water is available for humans to drink and use.
To find answers and make informed predictions, scientists look to the past. Reconstructions of past climate change using geologic data have helped to show the far-reaching influence of human activity on temperatures since the industrial age. But assembling hydroclimate records for the same timeframe has proved to be much harder.
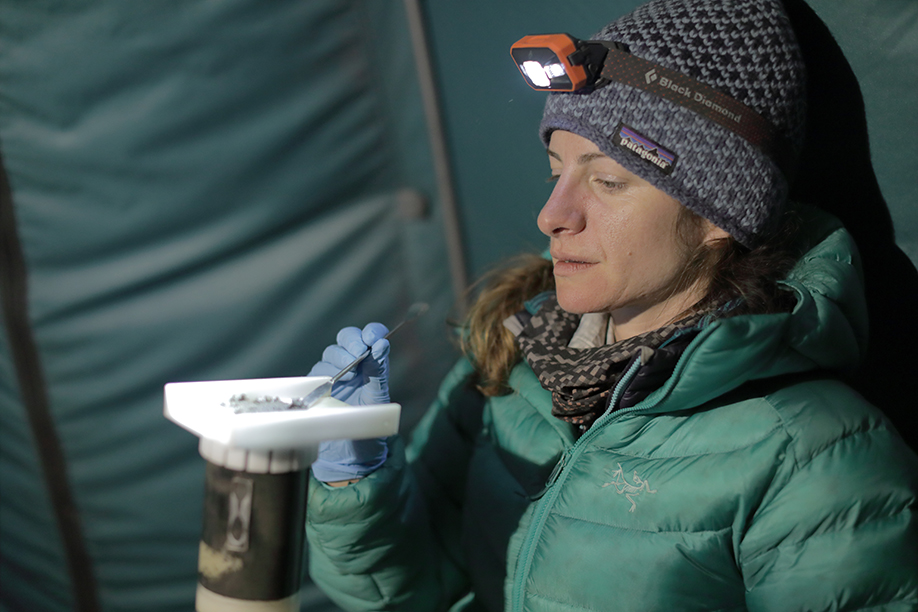
A study from the Past Global Changes (PAGES) Iso2k project team, led by Bronwen Konecky at Washington University in St. Louis, takes an important step toward reconstructing a global history of water over the past 2,000 years. Using geologic and biologic evidence preserved in natural archives — including 759 different paleoclimate records from globally distributed corals, trees, ice, cave formations and sediments — the researchers showed that the global water cycle has changed during periods of higher and lower temperatures in the recent past.
“The global water cycle is intimately linked to global temperature,” said Konecky, an assistant professor of earth, environmental and planetary sciences in Arts & Sciences at Washington University and lead author of the new study in Nature Geoscience.
“We found that during periods of time when temperature is changing at a global scale, we also see changes in the way that water moves around the planet,” she said.
The water cycle is complex, and rainfall in particular has geographic variations that are much more drastic than air temperature. This has made it difficult for scientists to evaluate how rainfall has changed over the past 2,000 years.
“We decided to start with water isotope records because they reflect holistic signals and because they’re recorded in all kinds of different natural archives,” Konecky said. “This is a first step toward reconstructing drought or rainfall patterns at the global scale during the past 2,000 years.”
An intertwined cycle
The global water cycle is vast and intertwined. Water evaporates from the surface of the Earth, rises into the atmosphere, cools and condenses into rain or snow in clouds, and falls again to the surface as precipitation. Each water molecule that is part of the cycle has a certain isotopic “fingerprint,” or composition, which reflects small variations in the atomic weight of the oxygen and hydrogen atoms that comprise the molecule. So, individual water molecules can be heavier or lighter.
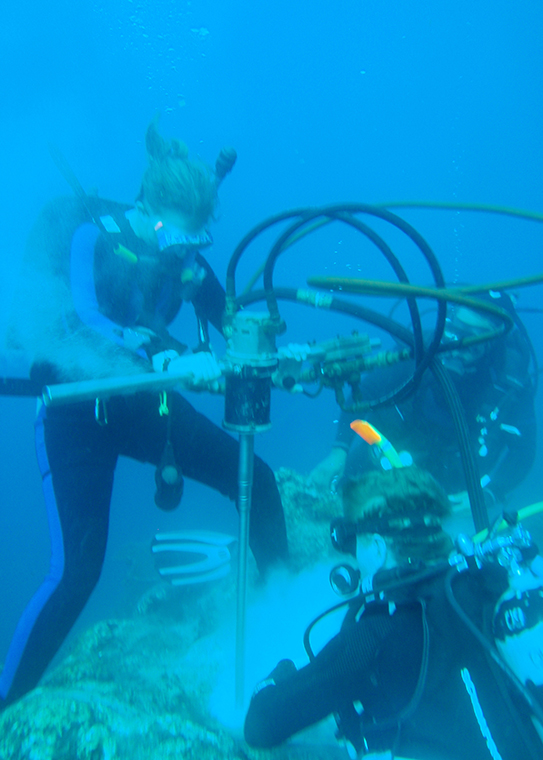
With this new study, the scientists found that when global temperature is higher, rain and other environmental waters become more isotopically heavy. The researchers interpreted these isotopic changes and determined their timeline by synthesizing data from across a wide variety of natural archive sources from the past 2,000 years of Earth history.
The PAGES Iso2k project team — which includes more than 40 researchers from 10 countries — collected, collated and sometimes digitized datasets from hundreds of studies to build the database they used in their analysis. They ended up with 759 globally distributed time-series datasets, representing the world’s largest integrated database of water isotope proxy records.
Piecing together signals from many different types of natural archives can be like piecing together apples and oranges. Konecky and the project team knew, however, that water isotopes record climate signals in specific ways in different natural archives. Carefully assembled, this common thread could help them to compare a tree ring to an ice core.
“Every archive is different,” Konecky said. “To make matters more complicated, datasets from different archives are generated by different scientific communities with their own terminology, norms and reference materials. We came up with data description fields (metadata) for the database that translate each record’s particularities into a common tongue that makes it possible to compare variations in one archive to variations in another. This process took years!”
The team met once in person and then did everything afterward by teleconference. They organized co-working sessions at odd hours to accommodate time zones from Hawaii to Japan to Australia to Europe and in between. “We even spent one New Year’s Eve working on the database and the analyses that led to this paper,” Konecky said.
More water cycle changes to come
Global scale relationships between temperature and the isotopic composition of certain environmental waters, like seawater and glacial ice, have long been recognized as the planet moves in and out of ice age cycles. Local scale relationships with temperature on time scales of minutes to months are also well established.

But this study provides the first evidence that temperature and the isotopic composition of environmental waters go hand in hand at time scales in between these two — that is, over decades to centuries.
It’s a rapid adjustment, Konecky said. “As the planet warms and cools, it affects the behavior of water as it leaves the oceans and the vigor of its motions through the atmosphere,” she said. “The isotopic signals in these waters are very responsive to temperature changes.”
The scientists found that global mean surface temperature exerted a coherent influence on the isotopic composition of global precipitation and “meteoric water” (water in lakes, rivers and ice melts) throughout the past 2,000 years. The changes they observed were driven by global ocean evaporation and condensation processes, with lower values during the period of time known as the Little Ice Age (1450-1850) and higher values after the onset of human-caused climate warming starting around 1850.
When it comes to the specific impact of these changes on future rainfall and water availability, it is too early to predict who will win and who will lose. But this study’s data from the last 2,000 years suggest that more water cycle changes are likely as global temperatures continue to increase. June, July and August 2023 were the hottest months on record for our planet.
“The way water behaves when it leaves the oceans and moves around the atmosphere and rains out — that behavior is strongly impacted by changes in atmospheric temperature,” Konecky said.

Konecky, B.L., McKay, N.P., Falster, G.M. et al. Globally coherent water cycle response to temperature change during the past two millennia. Nat. Geosci. (2023). https://doi.org/10.1038/s41561-023-01291-3
This research was funded in part by the National Science Foundation and the David and Lucile Packard Foundation.
